


The Baltic Dry Index (BDI) is a critical indicator of global trade, providing insights into the demand for shipping raw materials. It reflects the cost of transporting major raw materials such as coal, iron ore, and grain across the oceans. This analysis will provide a predictive outlook for August 2024, examining both technical and financial perspectives, and will include references to support the analysis.
Technical Analysis
Technical analysis involves studying historical price data and patterns to forecast future price movements. For the Baltic Dry Index, this means examining past trends, cycles, and technical indicators.
Historical Trends
The BDI has experienced significant volatility over the years, influenced by factors such as economic cycles, geopolitical events, and shifts in global trade patterns. To predict the BDI’s performance in August 2024, it is essential to consider historical trends and recent movements.
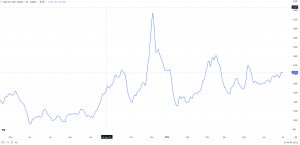
1. Long-term Trends: The BDI has shown cyclical patterns, often correlated with economic booms and busts. For instance, the index peaked during the global economic boom in the mid-2000s, followed by a sharp decline during the 2008 financial crisis. Since then, the BDI has experienced several smaller cycles, influenced by global trade dynamics and shipping capacity.
2. Short-term Movements: Over the past year, the BDI has shown a moderate uptrend, driven by recovering global trade post-pandemic and disruptions in supply chains. However, it has also faced downward pressures due to uncertainties in global economic growth and geopolitical tensions.
Technical Indicators
Several technical indicators can help predict the BDI’s movements in the near term:
1. Moving Averages: Moving averages smooth out price data to identify trends. The 50-day and 200-day moving averages are commonly used. If the 50-day moving average crosses above the 200-day moving average (a golden cross), it indicates a bullish trend. Conversely, if it crosses below (a death cross), it suggests a bearish trend.
2. Relative Strength Index (RSI): The RSI measures the speed and change of price movements, providing insights into whether the BDI is overbought or oversold. An RSI above 70 suggests overbought conditions, while below 30 indicates oversold conditions.
3. Bollinger Bands: These bands measure volatility and consist of a moving average with upper and lower bands. When the BDI price touches the upper band, it may be overbought, and when it touches the lower band, it may be oversold.
4. Volume Analysis: Examining the volume of trades can provide insights into the strength of a trend. Increasing volume during an uptrend suggests strong buying interest, while increasing volume during a downtrend indicates strong selling pressure.
Current Technical Analysis
As of July 2024, the BDI is experiencing a consolidation phase after a significant upward movement in the first half of the year. The 50-day moving average is trending above the 200-day moving average, suggesting a bullish outlook. However, the RSI is approaching overbought territory, indicating a potential pullback.
Bollinger Bands show the BDI nearing the upper band, suggesting high volatility. Volume analysis indicates strong interest in the index, supporting the possibility of continued upward movement, albeit with potential short-term corrections.
Financial Analysis
Financial analysis involves examining economic indicators, market conditions, and broader financial trends to predict future performance.
Global Economic Indicators
1. GDP Growth: Global GDP growth is a key driver of the BDI. As economies expand, demand for raw materials and shipping increases, driving up the index. In 2024, global GDP growth is expected to moderate compared to the post-pandemic recovery phase, with varying growth rates across regions.
2. Inflation: Inflation impacts shipping costs and commodity prices. Higher inflation can lead to increased shipping rates, boosting the BDI. Central banks’ monetary policies, aimed at controlling inflation, will play a crucial role in shaping the index’s future trajectory.
3. Commodity Demand: The demand for commodities such as iron ore, coal, and grain directly affects the BDI. In 2024, demand for these commodities is expected to remain strong, driven by industrial production and infrastructure development, particularly in emerging markets.
4. Geopolitical Factors: Geopolitical tensions and trade policies can significantly impact global trade flows and shipping costs. For instance, ongoing trade disputes or sanctions can disrupt supply chains and alter shipping routes, affecting the BDI.
Market Conditions
1. Shipping Capacity: The balance between shipping demand and capacity influences the BDI. Overcapacity in the shipping industry can suppress rates, while a shortage of ships can drive rates higher. In 2024, the shipping industry is expected to face tight capacity, supporting higher rates.
2. Fuel Costs: Fuel costs are a major component of shipping expenses. Fluctuations in oil prices can impact the BDI. With oil prices expected to remain volatile due to geopolitical factors and supply-demand dynamics, fuel costs will be a critical factor in shaping the BDI.
3. Supply Chain Disruptions: The COVID-19 pandemic highlighted the vulnerability of global supply chains. Any disruptions, whether due to natural disasters, pandemics, or geopolitical events, can affect shipping rates and the BDI.
Current Financial Analysis
As of mid-2024, the global economic outlook is mixed. While some regions are experiencing robust growth, others face economic headwinds. Inflation remains a concern, with central banks implementing measures to control it. Commodity demand is strong, particularly in Asia, supporting shipping rates.
Geopolitical tensions, particularly in Eastern Europe and the South China Sea, pose risks to global trade flows. Shipping capacity remains tight, with a limited number of new ships entering service, supporting higher rates. Fuel costs are volatile, influenced by fluctuating oil prices.
Predictive Outlook for August 2024
Combining technical and financial analysis, the predictive outlook for the BDI in August 2024 is as follows:
1. Technical Perspective: The BDI is expected to maintain its upward trend, supported by strong technical indicators. The moving averages suggest a bullish trend, although the RSI indicates potential short-term corrections. High volatility, as indicated by Bollinger Bands, suggests significant price movements in both directions.
2. Financial Perspective: The financial outlook supports the BDI’s continued strength. Global economic growth, particularly in emerging markets, will drive demand for raw materials and shipping. Inflation and fuel costs will remain key factors, with central banks’ policies and oil price fluctuations impacting the index. Geopolitical risks and supply chain disruptions pose potential challenges but also opportunities for rate increases.
3. Expected Scenarios:
– Base Case: In the base case scenario, the BDI continues its moderate upward trend, supported by steady global economic growth and strong commodity demand. The index is expected to reach levels around 2,500-2,800 by the end of August 2024.
– Bullish Case: In a bullish scenario, stronger-than-expected economic growth, particularly in Asia, combined with limited shipping capacity and high fuel costs, drives the BDI higher. The index could surpass 3,000 in this scenario.
– Bearish Case: In a bearish scenario, economic slowdowns in key regions, coupled with geopolitical tensions and supply chain disruptions, could lead to a decline in the BDI. The index might fall to levels around 2,000-2,200.
Conclusion
The Baltic Dry Index is a vital indicator of global trade and economic health. Based on the technical and financial analysis, the BDI is expected to maintain its upward trend in August 2024, supported by strong global economic growth and robust commodity demand. However, potential risks such as geopolitical tensions and supply chain disruptions could impact the index’s performance. By closely monitoring these factors and technical indicators, stakeholders can better navigate the volatile shipping market.
References
1. World Bank. (2024). Commodity Markets Outlook.
2. Bloomberg. (2024). Global Economic Outlook. Retrieved from Bloomberg database.
3. Reuters. (2024). Shipping Industry Analysis. Retrieved from Reuters database.
4. International Monetary Fund (IMF). (2024). World Economic Outlook. Retrieved from IMF website.